Projects

End-to-end projects, each with a working app you can try and full source on GitHub. The Streamlit apps are on the free tier, so the first visit after a while can take a few seconds to wake up.

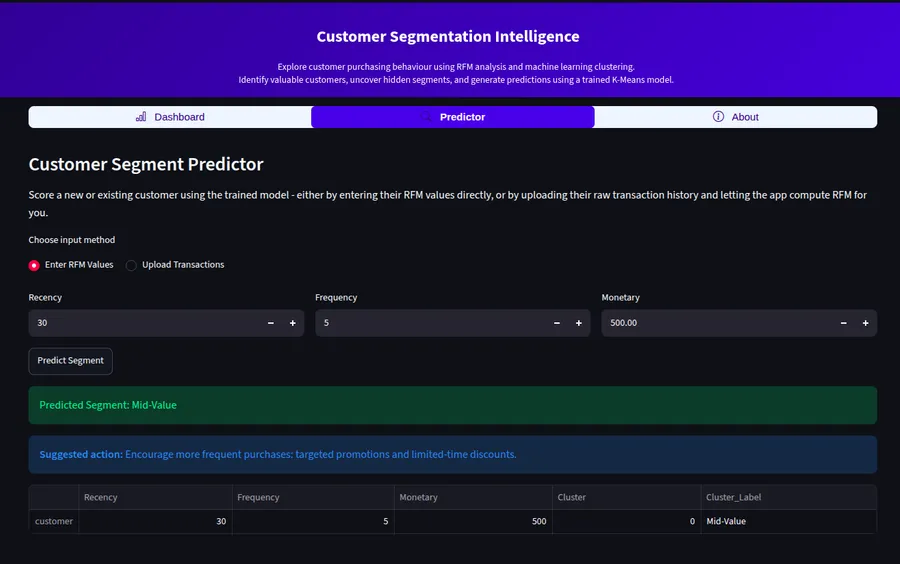
The Streamlit app's segment predictor: RFM values entered on the left, a predicted Mid-Value segment shown below.

Customer Segmentation Using RFM Analysis and K-Means Clustering

Groups customers by recency, frequency and spend, so a marketing team can target retention and re-engagement instead of treating every customer the same.

Built on the UCI Online Retail dataset - about 540,000 transactions from a UK-based online retailer over a year. Each customer is scored on Recency, Frequency and Monetary value (RFM), first with a rule-based scoring system, then with K-Means clustering on the scaled RFM values.

The number of clusters (k=4) was chosen using the Elbow and Silhouette methods, and each resulting cluster is labeled by its average spend rather than a fixed index, so the labels (VIP, Loyal High-Spender, Mid-Value, At Risk) stay meaningful even if K-Means assigns cluster numbers differently on a future run.

The pipeline is modular and covered by pytest, and a saved model can score new customers without retraining.

  • Python
  • pandas
  • scikit-learn
  • matplotlib
  • seaborn
  • pytest
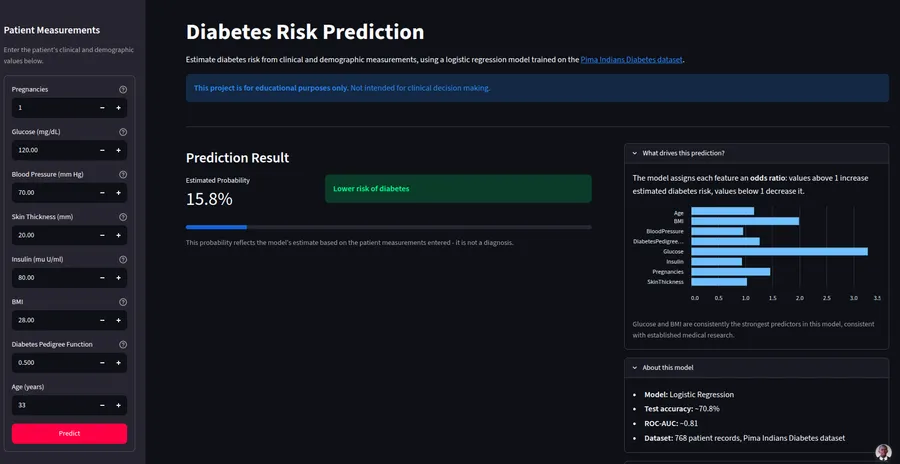
The Streamlit app's prediction form: patient measurements on the left, an estimated risk and the odds ratios driving it on the right.

Diabetes Risk Prediction

An interpretable logistic regression model that estimates diabetes risk from clinical measurements, built to be explainable rather than just accurate.

Trained on the Pima Indians Diabetes dataset (768 patients, 8 clinical and demographic features). The model reaches about 70.8% accuracy and a 0.81 ROC-AUC, a clear lift over the roughly 65% majority-class baseline.

Because it's logistic regression, every feature has an odds ratio that's shown alongside the prediction. Glucose is the strongest predictor (odds ratio ≈ 3.26), followed by BMI (≈ 1.99) and Pregnancies (≈ 1.46) - the app surfaces this reasoning, not just a number.

  • Python
  • scikit-learn
  • pandas
  • matplotlib
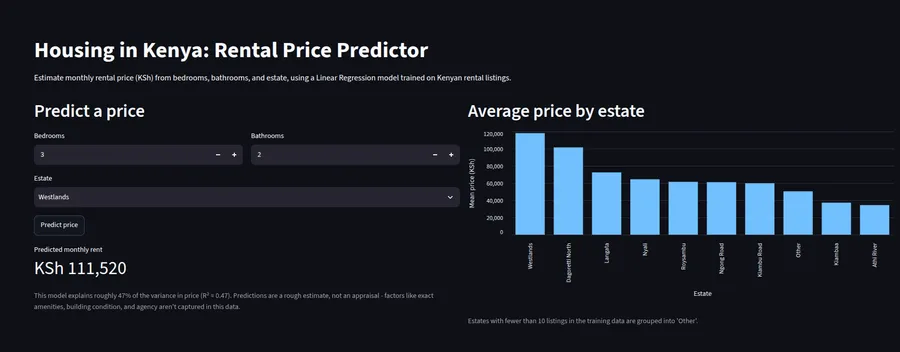
The Streamlit app's rental price predictor: bedroom, bathroom and estate inputs on the left, a predicted price and a chart of average price by estate on the right.

Housing in Kenya: Rental Price Predictor

Explores how bedrooms, bathrooms and location relate to rental price in the Kenyan market, and predicts a price range from those three features.

Built on a Kaggle dataset of Kenyan rental listings (1,557 cleaned rows after removing missing values and duplicate columns). Linear Regression and Random Forest models were trained and compared; both score about the same (R² ≈ 0.47), so the simpler Linear Regression model was kept as the one powering the app, since the added complexity of Random Forest didn't buy any accuracy here.

An R² of about 0.47 means bedrooms, bathrooms and estate explain under half the variance in price - that's a real limit of the feature set, not a bug, and the app states the R² next to every prediction so it isn't presented as more certain than it is.

  • Python
  • scikit-learn
  • pandas
  • matplotlib